{:th}
RSI( Relative Strength Index) คืออะไร
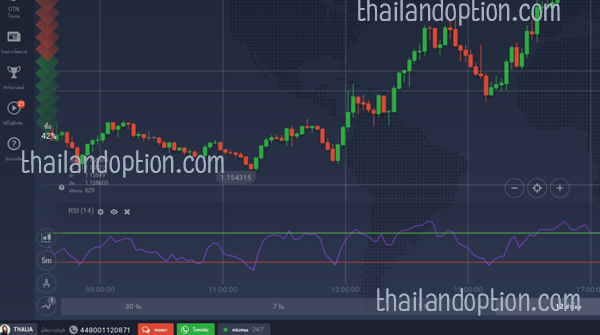
RSI( Relative Strength Index) หรือเรียกเป็นภาษาไทยว่า อา-เอส-ไอ หมายความว่า เป็น Indicator ชนิดหนึ่งที่ใช้วัดความแกว่งตัวของกราฟในราคาตลาด โดยนิยมใช้คู่กับอินดิเคเตอร์ที่เกี่ยวข้องกับการทำนายราคา จะมีความแม่นยำสูงมาก
จุดสำคัญในการใช้ RSI( Relative Strength Index) นั่นคือ เราจะดูค่าสองตัวประกอบไปด้วย Overbought หรือการซื้อมากเกินไป กับ Oversold หรือการขายมากเกินไป โดยค่ามาตรฐานในการตั้งค่า RSI คือ 9 และ 14 วัน
ประโยชน์ของ RSI( Relative Strength Index)
1.ใช้มองหาจุดเข้าของสัญญาออฟชั่นได้ โดยมักใช้คู่กับ SMA หรือ MACD เป็นต้น
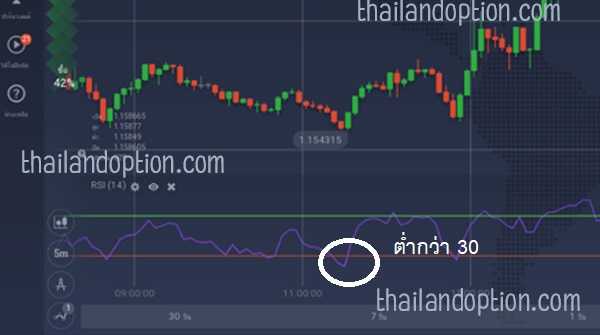
2.หากกราฟอยู่ต่ำกว่าเส้น 30 นั่นหมายความว่ากราฟจะกลับตัวเป็นขาขึ้น (ให้เราเปิดออฟชั่น Buy)
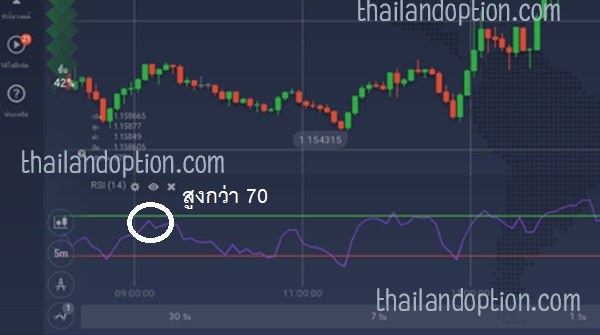
3.หากกราฟอยู่สูงกว่าเส้น 70 นั้นหมายความว่ากราฟจะกลับตัวเป็นขาลง (ให้เปิดออฟชั่น Sell)
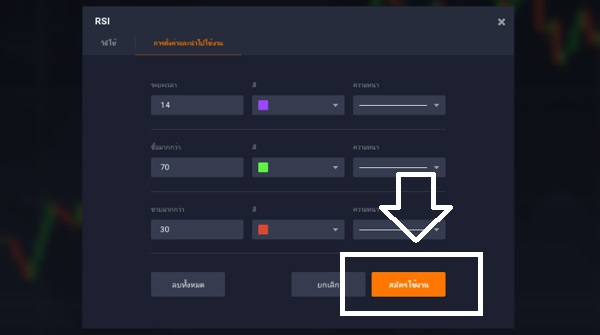
วิธีตั้งค่า RSI( Relative Strength Index)
1.คลิกข้อมูลตามภาพด้านล่าง
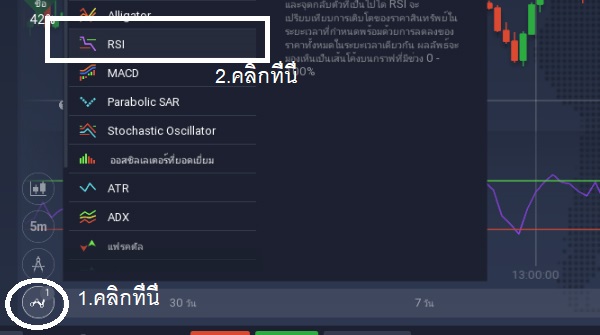
2.กดปุ่ม สมัครใช้งาน
เทคนิคการใช้ RSI( Relative Strength Index) ขั้นสูง
อย่างที่บอกไป การใช้ RSI แต่เพียงอย่างเดียวนั้นอาจไม่เพียงพอต่อการทำนายราคาที่จะเกิดขึ้นในอนาคต คุณจำเป็นต้องใช้อินดิเคเตอร์อื่นๆประกอบการตัดสินใจด้วยเสมอ{:}{:en}
What is RSI (Relative Strength Index)?
RSI (Relative Strength Index) is a type of Indicator that measures the fluctuation of the chart at market price. It is used in conjunction with indicators related to price prediction. It is very accurate.
The key to using the RSI (Relative Strength Index) is that we look at two factors with overbought or overbought vs. oversold or overbought. The default values for RSI are 9 and 14 days.
Benefits of RSI (Relative Strength Index)
1. Look for the entry point of the option contract. Usually used with SMA or MACD.
2. If the graph is below the 30 line, it means the graph is going up. (Let us open the option)
3. If the graph is above the 70 line, it means that the graph is going down. (Open the Sell option)
How to set RSI (Relative Strength Index)
1. Click on the image as shown below.
2. Press the Apply button.
Advanced RSI (Relative Strength Index) technique
As you said, using RSI alone may not be enough to predict future prices. You need to always use other indicators to make decisions.{:}{:vi}
RSI (Chỉ số sức mạnh tương đối)
RSI (Chỉ số sức mạnh tương đối) là một loại chỉ số đo lường sự biến động của biểu đồ theo giá thị trường. Nó được sử dụng kết hợp với các chỉ số liên quan đến dự đoán giá. Nó rất chính xác.
Chìa khóa để sử dụng chỉ số RSI (Chỉ số sức mạnh tương đối) là chúng tôi xem xét hai yếu tố có dư mua hoặc mua quá mức so với bán quá mức hoặc mua quá mức. Các giá trị mặc định cho RSI là 9 và 14 ngày.
Lợi ích của RSI (Chỉ số sức mạnh tương đối)
1. Tìm điểm vào của hợp đồng quyền chọn. Thường được sử dụng với SMA hoặc MACD.
2. Nếu biểu đồ dưới đường 30, có nghĩa là đồ thị đang đi lên. (Hãy để chúng tôi mở tùy chọn)
3. Nếu biểu đồ nằm trên đường 70, điều đó có nghĩa là đồ thị đang đi xuống. (Mở tùy chọn Bán)
Cách đặt RSI (Chỉ số sức mạnh tương đối)
1. Nhấp vào hình ảnh như hình bên dưới.
2. Nhấn nút Áp dụng.
Kỹ thuật RSI (Chỉ số sức mạnh tương đối) nâng cao
Như bạn đã nói, việc sử dụng RSI một mình có thể không đủ để dự đoán giá trong tương lai. Bạn cần phải luôn luôn sử dụng các chỉ số khác để đưa ra quyết định.{:}